CloudWatch vs CloudTrail: Which AWS Service Does What
Quick answer
CloudWatch monitors your infrastructure. CloudTrail audits your AWS account. They're not interchangeable — and confusing them leads to blind spots in both observability and compliance. Here's exactly what each one does, where they overlap, and how to use both correctly.
8 min read · AWS
CloudWatch and CloudTrail both collect data about your AWS environment, and they both write to S3 if you configure them that way. That's about where the similarity ends.
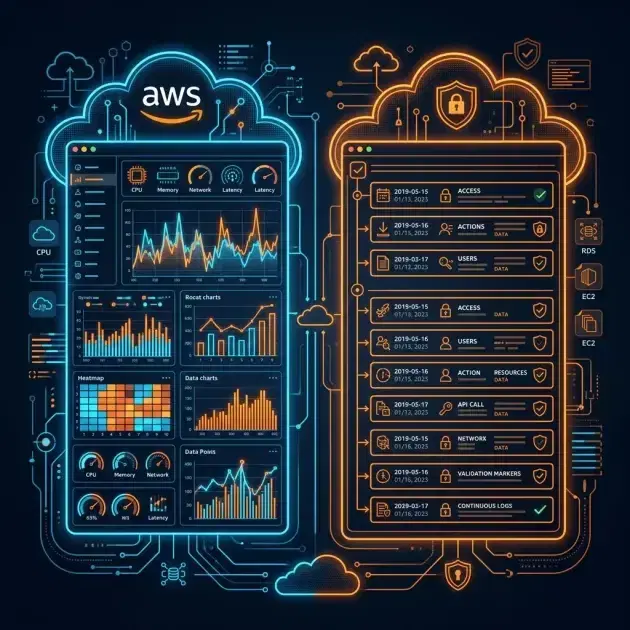
CloudWatch answers: is my application healthy right now? CloudTrail answers: who did what to my AWS account, and when?
If you're missing one, you have a different kind of blind spot. CloudWatch without CloudTrail means you can see your service is down but can't trace the IAM action that caused it. CloudTrail without CloudWatch means you have a full audit trail but no idea your containers are OOMing.
What CloudWatch Does
CloudWatch is your operational monitoring layer. It handles four things:
Metrics — numeric time-series data. Every AWS service publishes metrics automatically (EC2 CPU, RDS connections, ALB request count). You can also push custom metrics via the CloudWatch agent or the PutMetricData API.
Logs — structured and unstructured log ingestion. Application logs, VPC flow logs, Lambda logs, ECS task logs — they all end up in CloudWatch Logs Groups. You filter, query with CloudWatch Logs Insights, and set metric filters on top of them.
Alarms — threshold-based or anomaly detection alerts. An alarm fires when a metric breaches a threshold for N consecutive evaluation periods, triggering SNS, Auto Scaling, or an EC2 action.
Dashboards — visualization across accounts and regions.
1# Push a custom metric
2aws cloudwatch put-metric-data \
3  --namespace "MyApp" \
4  --metric-name "OrdersProcessed" \
5  --value 42 \
6  --unit Count
7
8# Query logs from the last hour
9aws logs start-query \
10  --log-group-name "/ecs/my-service" \
11  --start-time $(date -d '1 hour ago' +%s) \
12  --end-time $(date +%s) \
13  --query-string 'fields @timestamp, @message | filter @message like /ERROR/'
CloudWatch also includes Container Insights (per-pod metrics for ECS/EKS), Application Insights (automated anomaly detection for common app stacks), and Synthetics (canary monitoring).
What CloudTrail Does
CloudTrail records every API call made against your AWS account. Every time you (or an IAM role, or a Lambda function, or an attacker) calls an AWS API — CreateBucket, DeleteSecurityGroup, AssumeRole, RunInstances — CloudTrail logs it.
Each log entry includes:
- Who — IAM user, role ARN, account ID, source IP
- What — the exact API action and the request parameters
- When — timestamp in UTC
- Where — AWS region, source IP, user agent
There are three event types:
| Type | What it captures | Default |
|---|---|---|
| Management events | Control-plane actions: create, delete, modify resources | On |
| Data events | Object-level operations: S3 GetObject, Lambda invoke, DynamoDB GetItem | Off (high volume) |
| Insights events | Unusual API activity patterns | Off |
1{
2  "eventTime": "2026-05-30T14:23:11Z",
3  "eventSource": "s3.amazonaws.com",
4  "eventName": "DeleteBucket",
5  "sourceIPAddress": "1.2.3.4",
6  "userAgent": "aws-cli/2.15.0",
7  "userIdentity": {
8    "type": "IAMUser",
9    "arn": "arn:aws:iam::123456789012:user/john",
10    "userName": "john"
11  },
12  "requestParameters": {
13    "bucketName": "prod-backups-2026"
14  }
15}
That's what a deleted S3 bucket looks like in CloudTrail. You can query these with Athena if you store logs in S3, or stream them to CloudWatch Logs for near-real-time alerting.
AWS Cost & Architecture Review Checklist
The questions we ask in a paid AWS review — rightsizing, storage classes, network egress, and the usual five-figure surprises. Plain Markdown.
Free. Instant download. You'll also get the occasional deep-dive from the newsletter — unsubscribe anytime.
When Do They Overlap?
CloudTrail → CloudWatch Logs
You can configure CloudTrail to ship its logs to a CloudWatch Logs group. This lets you:
- Set metric filters on specific API calls (e.g., alert when root user logs in)
- Query with Logs Insights across both application logs and API audit logs
- Create alarms on security-relevant events
This is where the confusion starts. Seeing CloudTrail events in CloudWatch Logs does not make them CloudWatch events. The data originated in CloudTrail — CloudWatch is just a delivery destination.
EventBridge (formerly CloudWatch Events)
CloudWatch Events was renamed to EventBridge, and it integrates with both CloudWatch and CloudTrail. You can write EventBridge rules that trigger on CloudTrail events:
1{
2  "source": ["aws.iam"],
3  "detail-type": ["AWS API Call via CloudTrail"],
4  "detail": {
5    "eventName": ["CreateAccessKey", "DeleteAccessKey"]
6  }
7}
This triggers a Lambda function or SNS notification whenever an IAM access key is created or deleted — which is a useful security control.
When to Use Which?
Use CloudWatch when:
- You need to know if a service is up or degraded right now
- You're alerting on latency, error rate, saturation, or traffic
- You're debugging an application outage
- You need logs from your application code
Use CloudTrail when:
- Someone deleted a resource and you need to know who
- You need to prove compliance (SOC 2, PCI, HIPAA all require API audit trails)
- You're investigating a security incident
- You want to detect unusual IAM activity
Use both when:
- You're building a security posture: CloudWatch for real-time detection, CloudTrail for forensics
- You want to alert on specific API calls (stream CloudTrail to CloudWatch Logs, then set metric filters)
Is CloudTrail Enabled by Default?
Yes, but not fully. Every AWS account gets a free 90-day event history in the CloudTrail console for management events. What you don't get by default:
- Logs stored in S3 (you have to create a Trail)
- Multi-region coverage (a single-region Trail only covers one region)
- Data events for S3 and Lambda (these cost extra and must be explicitly enabled)
- CloudWatch Logs integration (must be configured)
For a production account, you want at least this:
1# Create a multi-region trail with CloudWatch Logs integration
2aws cloudtrail create-trail \
3  --name prod-audit-trail \
4  --s3-bucket-name your-cloudtrail-bucket \
5  --is-multi-region-trail \
6  --enable-log-file-validation \
7  --cloud-watch-logs-log-group-arn arn:aws:logs:us-east-1:123:log-group:CloudTrailLogs:* \
8  --cloud-watch-logs-role-arn arn:aws:iam::123:role/CloudTrailRole
9
10aws cloudtrail start-logging --name prod-audit-trail
Enable log file validation — it adds a SHA-256 hash of each log file to detect tampering. If you're ever in a security investigation, you need to prove the logs weren't modified.
The Quick Reference
| CloudWatch | CloudTrail | |
|---|---|---|
| Purpose | Operational monitoring | API audit and compliance |
| Data type | Metrics, logs, alarms | API call records |
| Retention | Configurable (metrics: 15 months default) | 90-day history; S3 indefinitely |
| Cost model | Per metric, per GB of logs | Per event (data events cost extra) |
| Default on? | Yes (basic metrics) | 90-day history only |
| Real-time? | Yes | Near-real-time (delivery within ~15 min) |
| Query tool | Logs Insights, Metrics Explorer | Athena, Logs Insights |
If you only remember one thing: CloudWatch is for your application's health. CloudTrail is for your account's security. Both are mandatory in production — they're not alternatives.
Was this article helpful?
Be the first to rate this article
Related Topics
Found this useful? Share it.